When the Light Dims by 5 %, How Many Good Pixels Turn Into Defects?
ALGORITHM
With the decision line fixed, a 5 % drop in lamp output makes a checker read 19 % of good pixels as defects.
AI anomaly detection also loses score when the lighting changes. Before choosing a model, write down in numbers how far the lamp wanders.
About 16 min read
Put a matte molded cover on the inspection stage and switch on a dome light. The surface is matte and scatters light evenly in all directions, and I assume its reflectance1 is middling. On the camera screen the good surface sits near 140 on the 8-bit brightness scale2, and a scratched spot sits near 119, 15 % darker. Both are assumptions for the calculation. The 21 steps between them are all the verdict has to lean on, so on the first day of commissioning the line is drawn at the midpoint, 129.5, and everything below it is called a defect.
That line stays where it is while the lamp ages. Under a lamp whose output slowly falls, the good surface starts to slide down from 140, and as the gap to the line shrinks, good pixels cross over to the defect side. Swap the worn lamp for a new one and the brighter scratches climb above the line and pass inspection. On the dim side, good parts pour into the reject bin and one more person is added to re-inspection; on the bright side, scratched parts are packed into the good bin. At what size of lighting change does this line give way?
The VAND 4.0 Challenge report3 (paper number 2610.04392), posted to arXiv on October 3, puts the same question in scores. Scored again with only the lighting setting changed, all nine methods entered in the regular setting lost points. The calculation below carries that drop over to the lamp in a real station.
The same scenes, scored again under different lighting
MVTec AD 2 is a data set of factory part images, and the report used it to pit industrial anomaly detection4 methods against each other. The test images come in two sets. The first, TESTpriv, was shot under the same lighting as the training images, and the second, TESTpriv_mix, shows the same scenes under randomly varied lighting settings (Sec. 3.2). The parts, the cameras and the positions are unchanged; only the light differs. The score, SegF15, expresses on a 0 to 100 scale how accurately defective pixels were painted.
In the regular-setting table (Table 1), SuperADD, ranked first, fell from 57.42 to 54.35, and ISVL++, ranked second, from 58.31 to 53.75. The largest drop was ST, from 41.53 to 33.97, a loss of 7.56 points or 18.2 % in relative terms. The smallest was DL-SubspaceAD, from 46.88 to 45.36, a loss of 1.52 points (3.2 %). Across all nine methods the mean drop is 4.26 points, and the mean relative drop is 9.3 %. In this table I would read the gap between the two columns before the ranking.
The table does not say by what percent the lighting changed. The report states that the test is meant to gauge changes that come from different machine setups or from the aging of illumination sources (Sec. 3.1), and Sec. 4.1 says robustness to illumination shifts remains a central difficulty. How many percent of lamp output a given drop corresponds to cannot be read from the table alone. The calculation starts in front of the model, at the brightness scale the camera receives.
A scale with a shifted zero reads the same object differently
The brightness of one pixel is set by multiplying the amount of light the lamp pours onto that spot, the share the surface sends back toward the camera (reflectance), and the time the sensor collects light. Because it is a product, a 5 % drop in lamp output darkens the good surface, the scratch and the background by the same 5 %. The ratio stays put; what moves is the absolute scale. The good surface at 140 becomes 133 and the scratch at 119 becomes 113.05, so the 15 % contrast is untouched while the gap between the two values shrinks from 21 to 19.95. This structure, image brightness as the product of an irradiance function and a reflectance function, is also what claim 1 of US 6,445,812 B1 (Siemens Corporate Research Inc.), a patent on illumination compensation for industrial inspection, puts in writing.
Noise rides on every pixel as well. Even when the sensor shoots the same surface repeatedly, the value wobbles a little, as in 140, 137, 144, and I assume the width of that wobble, the standard deviation σ6, is 4 steps. Good-surface values spread about 4 steps either side of 140, and the distance to the line is 10.5 steps, 2.6 times σ. At that distance, on the first day only a little over 4 of every 1,000 good pixels fall below the line.
To read how far the zero has sagged from inside the picture, one reference object is needed. The figure below shows a gray tile with unchanging reflectance standing in one corner of the inspection field, with the part and the tile lit by the same lamp.
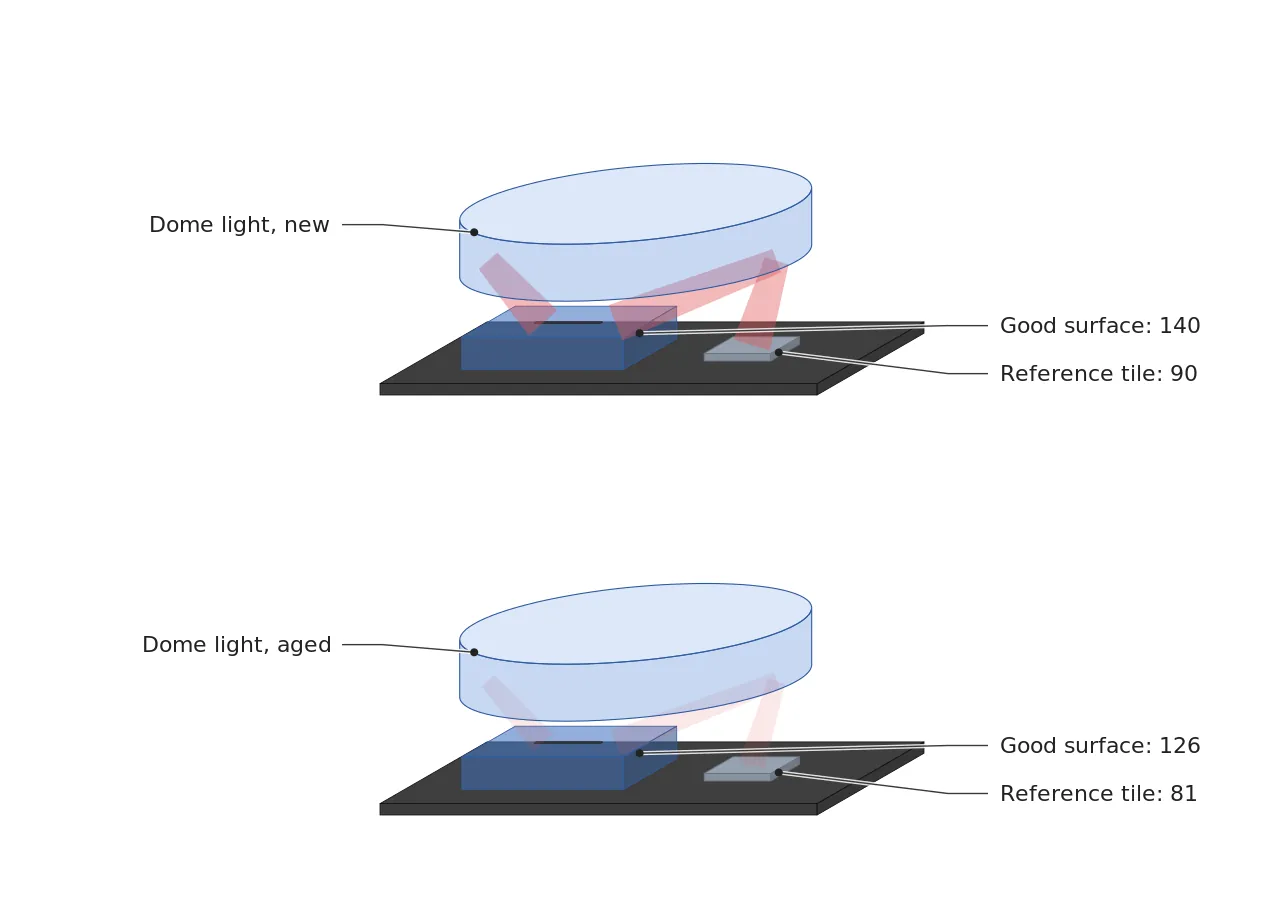
What I look at first in the figure is the spot where tile and part receive the same light, because the tile value becomes the scale for reading lamp output at that moment. If the tile reads 90 on a day when the good surface reads 140 (the tile value is an assumption for the calculation), then on a day when the tile has fallen to 81 I read the lamp as 10 % down. That settles how to read the zero, but not yet how fast the line gives way.
At 5 % less light, 19 % of good pixels fall below the line
The calculation takes one line of a normal distribution. When the lamp loses d %, the center of the good surface falls to 140×(1−d), and the share of pixels dropping below the line at 129.5 comes from the distance between line and center divided by σ=4. At d=0 that value is 2.63 and the share is 0.43 %. With just 1 % less light it is 1.15 %, at 2 % it is 2.71 %, and at 3 % it is 5.76 %. Up to 3 % false alarms grow about thirteen-fold without looking like an accident, but at 5 % the share is 19.08 %, at 7.5 % exactly half, 50 %, and at 10 % it is 80.92 % of good pixels that end up under the line.
The bright side is counted the same way. When the scratch center, 119, rises with the lamp and reaches the line at 129.5, half of the scratches pass, and that point comes when the lamp is 8.82 % brighter. At 3 % brighter, 4.16 % are missed; at 5 %, 12.77 %. The figure puts both sides on one axis.
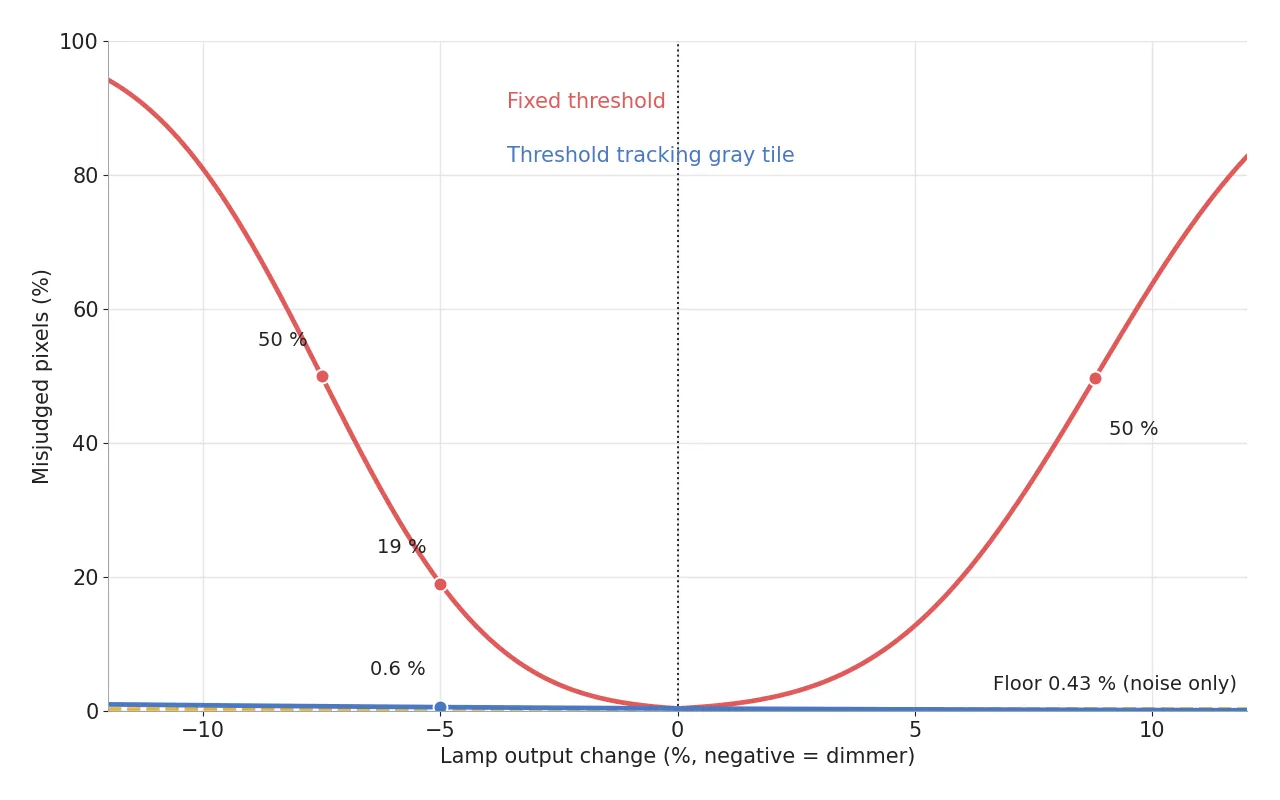
What catches my eye first in the figure is the place where the red curve leaves the floor. Moving left (dimmer), the share of good pixels falling below the line grows, and moving right (brighter), the share of scratched pixels rising above the line grows. On either side the curve lifts to 4 to 6 % near 3 % and then climbs steeply through the 6 to 9 % range to close to half. The blue curve is the error rate when the line is tied to the reference tile, and it stays under 1 % across the whole ±10 % range.
The gap of 21 steps is more than five times the 4-step noise width, so the first-day error is a low 0.43 %, but for the same reason the line enters the middle of the distribution quickly. These numbers belong to the simplest possible judge, one that splits each pixel with a single line, and they rest on the idealized assumption that noise is independent. There is no basis for saying a trained model follows this curve exactly. The report’s drops stay within 3.2 to 18.2 %, which suggests models absorb some of the brightness change, but how much they absorb cannot be read from the report. Three numbers from this curve are worth keeping.
0.43%
False alarm share on day one (σ and line position assumed)
19.08%
False alarm share when lamp output drops 5 %
8.82%
Brightening at which half of the scratches pass
The 0.43 % on day one is acceptable at equipment acceptance, but when the same station’s lamp ages by only 5 %, it becomes 19.08 %. The 8.82 % on the bright side is a story about the day the lamp is replaced. If the new lamp comes out that much brighter than the old lamp’s last output, half of the scratches pass. Lamp replacement is the most expensive maintenance job and also the quietest way to move the decision line. Whether the line is fixed or tied to the lamp, I take it that you have to know how far the lamp has moved.
Tie the decision line to a reference tile and fix the zero with exposure
Tying the line to the lamp is simple. Instead of nailing the decision line to the absolute value 129.5, set it as a multiple of the tile brightness. If the tile was 90 and the line 129.5 on day one, the ratio is 1.439, and on a day when the tile has fallen to 81 the line follows down to 116.55. Even when the good surface falls to 126, the distance to the line stays at 9.45, so on a day when the lamp is 10 % down, false alarms still hold at 0.91 %.
The gap between the two distributions does shrink while the line follows. At 7.5 % less light it narrows from 21 to 19.43, at 10 % less to 18.9, and false alarms creep up to 0.76 % and 0.91 %. The correction puts the mean back in place, but it cannot restore the contrast span or the signal-to-noise ratio that were lost. Software has a limit to how much of the lamp’s aging it can cover, and in my judgment the time spent holding on within that limit should be used to schedule work on the lamp.
Restoring the zero with exposure is another route. If the lamp is 7.5 % down, raise exposure by a factor of 1.0811, which turns a 100 μs strobe7 pulse into 108.1 μs (pulse width assumed). Because it returns the amount of light itself, the signal-to-noise ratio returns too, and it goes one step beyond tying the line. The limits are how far the pulse can be lengthened and how far the brightest spot in the frame stays below 255.
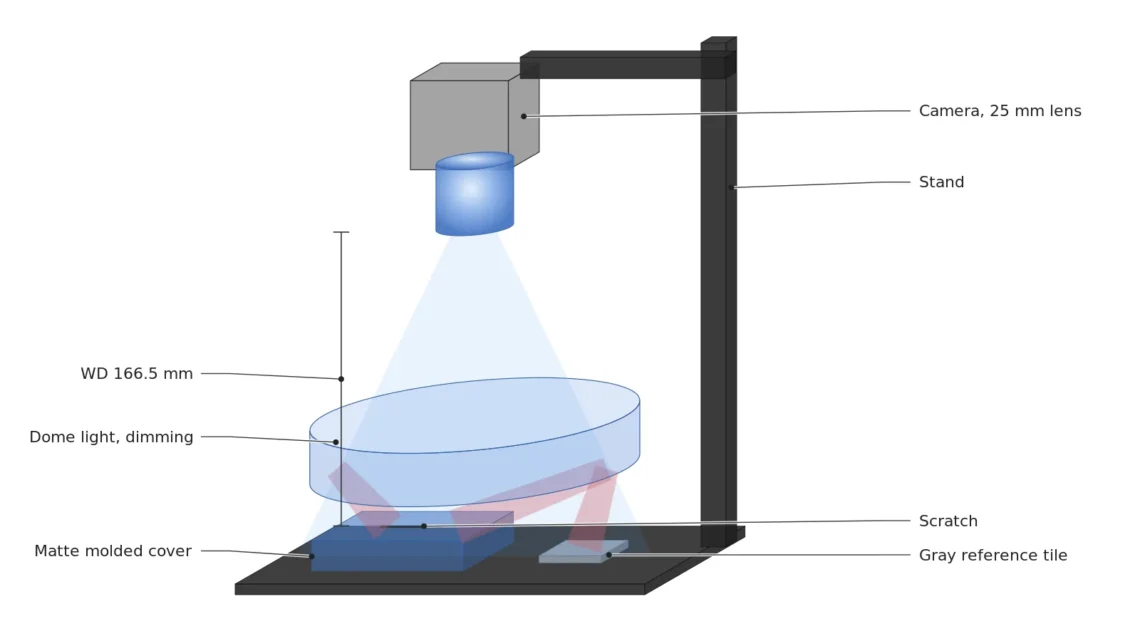
Drawing how all these parts sit over the inspection stage makes the order visible. The camera and dome light are fixed above the part, the tile stands in one corner of the field, and the judgment signal runs from the controller to the pass and fail indicators.
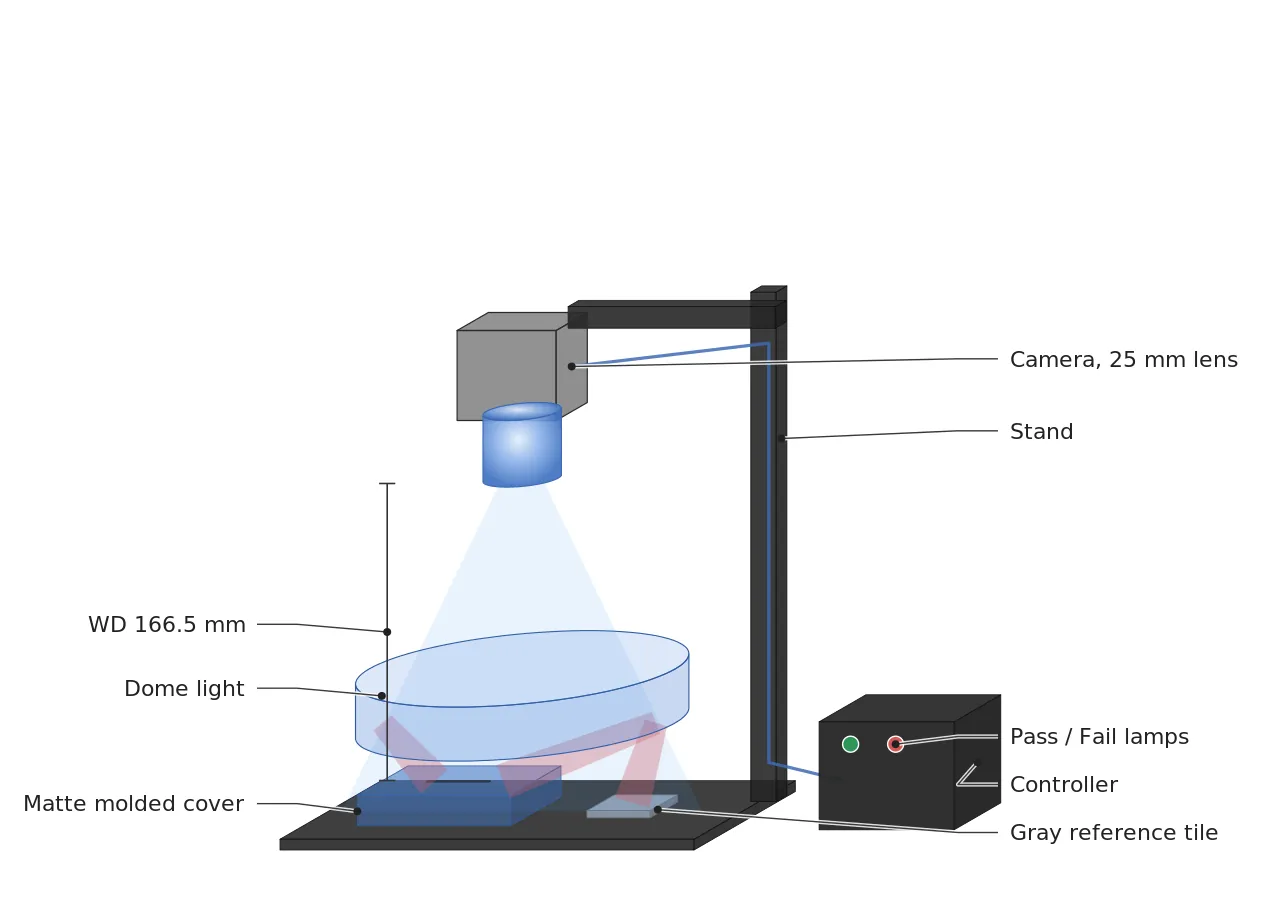
The lens in the figure hangs WD8 166.5 mm above the part. The 80 mm field, 4,096 px width, 3.45 μm pixel and 25 mm lens are all assumptions for the calculation, and dividing the field by the pixel count gives 19.53 μm9 per pixel. By my standard, which needs three pixels filled before a scratch counts as seen, anything smaller than 58.6 μm is not this setup’s job. The 166.5 mm is measured from the lens principal plane, so the distance actually to be kept clear between the front of the lens and the part is an item to check in the manufacturer’s data sheet.
The surface is matte, which is why the calculation so far has been simple. On a glossy surface such as a plated terminal, diffuse and specular reflection10 mix, and when lamp output changes the glints move with it. It is hard to assert that part brightness fell by the same ratio just because the tile value dropped 10 %. For such materials nothing can be guaranteed before a sample test, so until then the curves above are for reference only. Moved into the spec sheet, the calculation shrinks to three lines, filled with the assumed field and camera below.
| Item | Value | Condition and basis | In plain words |
|---|---|---|---|
| ① Smallest defect size | 58.6 μm | 3 px × 19.53 μm/px (80 mm field ÷ 4,096 px, assumed) | Scratches under 0.06 mm do not fill three pixels |
| ② Optical setup | Dome light, 25 mm lens, WD 166.5 mm (availability to be checked) | Sensor width 14.13 mm (3.45 μm × 4,096 px), magnification 0.1766, WD = f × (1 + 1/magnification), principal plane | About 17 cm between lens and part has to be kept clear |
| ③ Algorithm parameters | Reference tile 50×50 px, decision line = tile mean × 1.439, alarm at 0.24 steps (0.171 %) | σ÷√2,500 = 0.08 steps, 3σ = 0.24 steps (independent noise assumed) | An alarm goes off when the lamp moves by 0.2 % |
Scratches under 58.6 μm do not fill three pixels in this setup, and the decision line tied to the tile raises an alarm when the lamp moves by just 0.2 %. The third line is the cheapest of the three and the one most often left out. In my standard, the first line of a spec sheet holds the size of the defect and the second holds the allowed range of lighting change. The same lines need to be there on the day an AI anomaly detection model goes in. How many points a model will lose depends on how different the lighting is now from the lighting at training, and without a record of that difference there is no way to explain the drop.
Work out the efficiency score before you grow the model
The same report also proposed a score that puts efficiency into the ranking. The efficiency score E11 multiplies performance q, speed τ, memory use μ and power π, then takes the fourth root. Speed is normalized as t÷(t+30) around 30 frames per second, and memory and power against limits of 64 GB and 56 W. Speed beyond 30 frames earns reward slowly: τ is 0.5 at 30 frames per second, 0.667 at 60 and 0.8 at 120.
Calculating two assumed systems shows the character of the score. A has the highest performance at 0.57 but is an ensemble running 8 frames per second on 40 GB and 45 W, while B is a light model with performance 0.50 running 45 frames per second on 6 GB and 12 W. All the numbers are assumptions, and q is taken as SegF1 divided by 100. E comes to 0.307 for A and 0.680 for B, so B leads by a factor of 2.2. By my calculation, speed and resources are worth more than the 0.07 of performance given up.
Add the lighting story and a fork appears. If a large model is left to absorb the points lost to a wandering lamp, you end up with a system like A; if lighting change is narrowed with a reference tile and exposure correction, a light model like B can work inside the lighting it was trained on. To my eye, fixing the lighting looks cheaper. The other side has its own winning conditions. If lamp specifications differ from stage to stage and cannot be matched on site, putting several lighting conditions into the training images comes first, and its effect cannot be guaranteed before a sample test.
Who logs the lamp and who pays to replace it
The people who do this calculation for a living are machine vision engineers. To anyone just entering the work, I recommend building a reference tile and a brightness log before memorizing model names. A person who holds the lamp’s wander as a number and one who does not ask different questions in front of the same score drop. The first asks by how many percent the lamp moved; the second begins by asking whether the model has to be retrained.
From the side that funds the equipment, the same calculation changes the maintenance items. The lamp replacement interval and the procedure for resetting the decision line right after replacement go into the quotation as one line, and equipment without that line carries the risk of letting scratches through on the day of replacement. This article explains technology and is not investment advice. See our Disclaimer.
Field Note
The shutter curtain of a mechanical film camera drifts away from its marked speed with age. The dial still points at 1/500 s, but the time the curtain really takes differs, so the light the film receives changes from what the label says. A lamp does the same, with the controller setting unchanged while the output sags. With a new setup I write down the tile value on the first day, and I schedule lamp work at the 3 % line, where the tile has fallen to 97 % of that value. At that line the fixed decision line already gives 5.76 % false alarms, so by the numbers there is no reason to wait longer.
Field Checkpoints
Once the tile value is written down on day one, the next job is crossing off installation conditions one by one.
- Is WD 166.5 mm from the lens principal plane to the top of the part still available after adding fixture height and dome light height? (whether room is left for the light and for a hand)
- Does the reference tile sit in a corner of the field and stand in the same place on the same face even when the part changes? (whether dust or color change is settling on the tile)
- On the first power-on day, were the tile mean and the good-surface mean written down from the same picture? (whether it is the zero for every later comparison)
- Is there a defined procedure for resetting the decision line right after the lamp is replaced or its setting is changed? (whether a bright new lamp will let scratches through)
- Was the surface to be inspected noted first as matte or glossy plating? (whether the curves above can be used on a glossy face before it is checked on sample images)
- Was the difference in tile value between the training pictures and the station recorded in percent? (whether the lighting gap the model meets can be stated in numbers)
Frequently Asked Questions
What makes a good reference tile?
A matte, mid-gray tile whose surface does not change and does not glint is a safe choice. If it is imaged at a brightness close to the good surface it can be read within the same exposure range, and if it is too bright it reaches 255 when the lamp rises and the value is clipped.
Which is more dangerous, a dimming lamp or a brightening one?
Under these assumptions half of the good pixels become defects at 7.5 % dimmer, and half of the scratches pass at 8.82 % brighter. The dim side shows up as false alarms that are hard to miss, while the bright side only adds passes and shows up late if no record exists.
Glossary
- [1] Reflectance reflectance
The share of the light reaching a surface that comes back off it. White paper is high and black cloth is low, so the same lamp produces different brightness in the camera. ↩ - [2] 8-bit gray level 8-bit gray level
The brightness of one pixel written in 256 steps, from 0 (pure black) to 255 (pure white). The 140 and 119 in the text are numbers on this scale. ↩ - [3] VAND 4.0 Challenge VAND 4.0 Challenge
A competition that sets anomaly detection methods for industry and logistics against the same exam. Scoring uses hidden-label test images. ↩ - [4] Anomaly detection anomaly detection
A method that learns from normal images only and then finds places that depart from normal. It is common on lines where defect images are hard to collect. ↩ - [5] SegF1 segmentation F1
One number for how well the pixels a model paints as defective overlap the truly defective pixels. ↩ - [6] Standard deviation σ standard deviation
The width over which values scatter around their mean when the same surface is shot repeatedly. The text assumes 4 gray steps. ↩ - [7] Strobe strobe
Lighting that flashes only during the short moment the shutter is open. Lengthening the pulse brightens the picture. ↩ - [8] WD working distance
The distance from the lens to the top of the part being inspected. The text calculates it from the lens principal plane, and the reference plane a maker uses has to be checked in the data sheet. ↩ - [9] μm micrometre
A length of 1 mm divided by 1,000. It is the smallest ruler tick cut into a thousand pieces. ↩ - [10] Diffuse and specular reflection diffuse and specular reflection
Diffuse reflection scatters light in all directions off a rough surface. Specular reflection throws light in one direction off a smooth surface at the angle it arrived. A camera placed in the specular direction sees that spot blown out to white. ↩ - [11] Efficiency score efficiency score E
One number made by multiplying performance, speed, memory and power. Multiplying keeps a single weak factor from hiding behind the others. ↩
References
- L. Heckler-Kram et al., Detecting Defects that Matter: An Application-Driven Benchmark for Anomaly Detection in Manufacturing and Retail Logistics (VAND 4.0 Challenge), arXiv:2610.04392v1, October 3, 2026 (Table 1, Sec. 3.1, 3.2, 4.1)
- Patent US 6,445,812 B1, Siemens Corporate Research Inc., Illumination compensation system for industrial inspection, granted September 3, 2002
- Formulas: false alarm share = Φ((T − 140 × (1 − d)) ÷ σ), miss share = 1 − Φ((T − 119 × (1 + d)) ÷ σ), T = 129.5, σ = 4, Φ is the standard normal cumulative distribution, exposure correction factor = 1 ÷ (1 − d), reference tile sensitivity = 3 × σ ÷ √(tile pixel count), efficiency score E = (q × τ × (1 − μ) × (1 − π))^(1/4), τ = t ÷ (t + 30)

Noctvision
An engineer who designs secondary-battery manufacturing equipment keeps this record while studying local AI on single-board computers such as the Raspberry Pi and Jetson.

You May Also Like
Why Are the Ends of a Line Scan Image Dark? — Choosing Focused or Diffuse Line Lights and Compensating the Cosine-Fourth Falloff
The Camera Cannot Be Bolted On Last — Reserving Space and WD for Vision Cameras and Lighting at the Mechanical Design Stage