Why Are the Ends of a Line Scan Image Dark?
LIGHTING
The ends of a line scan image are dark because the lens takes 23 % off first, and only a light profile 1.3 times brighter at the ends brings back both brightness and noise.
For a 4,096 px line sensor viewing 300 mm across, I calculated the cosine fourth falloff, the end droop of a bar light and how far the light band slides when the height wavers by 2 mm.
About 13 min read
In an image of a 300 mm wide field taken with a 4,096 px line sensor, the ends are 0.77 times as bright as the center. However evenly the light falls, this number remains, because the cause lies with the lens more than with the light. If the surface is a matte molded panel that scatters light in every direction, the amount of light sets the image brightness more than the direction of reflection; on a surface with a component that bounces in one direction, such as hairline-finished metal, the lighting angle matters on its own as well.
With dark ends, the same decision line misses defects at the edges, and lowering the line to suit the edges raises false rejects in the center. Add a panel whose height wavers so the obliquely incoming light band slips off the line the camera sees, and a stretch with no defects goes dark as a whole, giving a run of false decisions. A line scan camera builds the image one line at a time, so the light on that single line sets the contrast1 of the whole image.
The question is what to fill the ends with. I would fill them first with the lengthwise distribution of the light, ahead of any software gain, and set the oblique angle to suit how far the height wavers. The calculations assume a 4,096 px line sensor with 7 μm pixels and a 35 mm lens viewing 300 mm across; one pixel then covers 73.2 μm, and the WD2 from the lens principal plane to the panel is about 401 mm.
The number 0.77 comes from the lens
The brightness of light reaching the sensor through a lens falls roughly as cos⁴θ with the angle θ off the optical axis. This natural falloff, called the cosine fourth law3, appears even without mechanical vignetting from the lens barrel blocking light, and stopping down does not remove it. A line scan field is long in one direction only, so the field angle easily grows large, and the falloff shows up strongly.
In this setup the sensor length is 4,096 × 7 μm = 28.7 mm and the magnification is 0.0956, so the thin-lens object distance comes to about 401 mm. The half field angle4 to the edge of the field follows from tanθ = 150 ÷ 401 as 20.5°, and cos⁴(20.5°) is 0.77. Even with perfectly even lighting, the signal at the ends stays at 77 % of the center. Real lenses drift a little from this value with their barrel design and stop position, so it is checked once against the relative illumination curve from the lens maker or an image of a white reference, and that figure becomes the starting point for the calculations that follow.
The longer the focal length, the smaller the half field angle for the same field, and the closer this number gets to 1. View the same 300 mm with a 70 mm lens and the object distance grows to about 802 mm, the half field angle drops to 10.6° and cos⁴ becomes 0.93. In exchange the WD doubles, so the mounting height has to be secured separately, and whether the longer lens also keeps the resolution has to be checked with the MTF of line scan lenses. Filling the 0.77 of a short lens with light or avoiding it with a long lens is the first fork in the design.
Correction gain of 1.3 returns only brightness
The easiest way to fill the 0.77 at the ends is flat-field correction5, which multiplies each pixel by a correction gain. Multiply the edges by 1 ÷ 0.77 = 1.30 and the image brightness turns flat. The upper graph in the figure below shows the lens falloff curve and the flat line after correction.
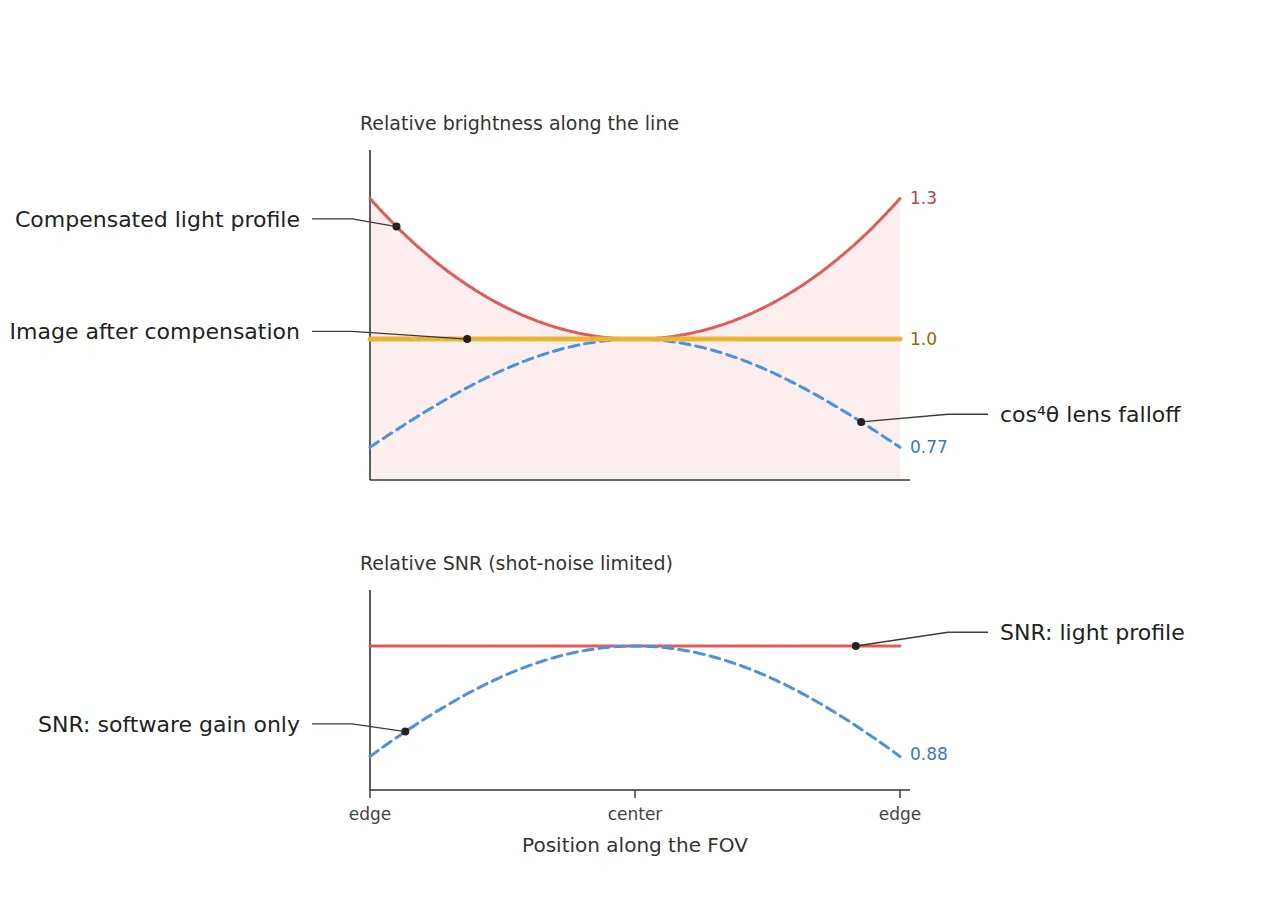
The lower graph shows the difference. Shot noise6, the wavering in the number of light particles, follows the square root of the signal, so at the edges where the signal is 0.77, the signal-to-noise ratio7 stays at √0.77 = 0.88 of the center. Gain scales signal and noise by the same factor, so this 0.88 remains after correction. Shape the light to be 1.3 times brighter at the ends instead, and more photons actually arrive at the edges, so the SNR matches the center too.
So I fill most of the gap with the light profile and use flat-field correction only to trim the last few percent. An edge SNR 12 % lower means that, with the same decision line, noise crosses the line more often at the edges only, or fine defects are buried in noise more often there, and nobody gets to choose where in the image a defect will appear. How much the detection rate falls depends on the decision line and the contrast of the defect, so 12 % does not translate directly into a 12 % lower detection rate, yet the direction stays the same: under one decision line, only the edges are at a disadvantage. How much correction gain amplifies noise is calculated separately for an area camera in the limits of flat-field correction.
A bar light also droops at its own ends
The lens is not the only thing that trims the ends. A line light is a bar of LEDs lined up along its length, so a point on the surface receives light from the LEDs on both sides. The middle of the field gets both neighbors, but near the end of the bar one neighbor is missing, and it gets darker by that much.
Assume the light sits 70 mm from the panel and the LEDs spread their light evenly along the length; the calculation then gives an irradiance at the end of the field of 0.51 of the center when the bar is as long as the 300 mm field. Lengthen it by 30 mm on each side and that becomes 0.76; add 60 mm on each side for a 420 mm bar and it rises to 0.89. The lens 0.77 and the bar droop multiply, so a bar bought to match the field width leaves the ends at 0.40 of the center, below half.
When choosing a bar length
it seems a light as long as the field would cover the ends evenly.
Calculating the end droop
a 300 mm bar for a 300 mm field lights the field ends at only 0.51 of the center. It takes 60 mm more on each side to reach 0.89.
So the bar length is set by adding margin on both sides of the field width, and the remaining end droop and lens falloff are filled by a profile that splits the LED drive current into zones and boosts the ends. The 1.3 in the figure refers to irradiance on the surface, so once the 0.89 of the bar itself is counted, the LEDs at the ends need to run a little over 1.45 times stronger than the center. My standard is to secure enough length first so the droop of the bar itself stays above 0.9, and for a light without zoned current control, I choose to lengthen the margin further. When setting the zone currents, the end zones are raised one step at a time while imaging a white reference, stopping where the lengthwise brightness before correction falls within ±5 %.
When the height wavers the light band slides sideways
Line scanning has short exposures, so the light has to be gathered into a narrow band. With a line period of 50 μs, the exposure is around 45 μs, and getting the same signal as an area camera with a 1 ms exposure takes light 22 times stronger. That is why a focused line light8 gathers the LED output into a band a few mm wide with a rod lens, and that band keeps its width only at a set distance.
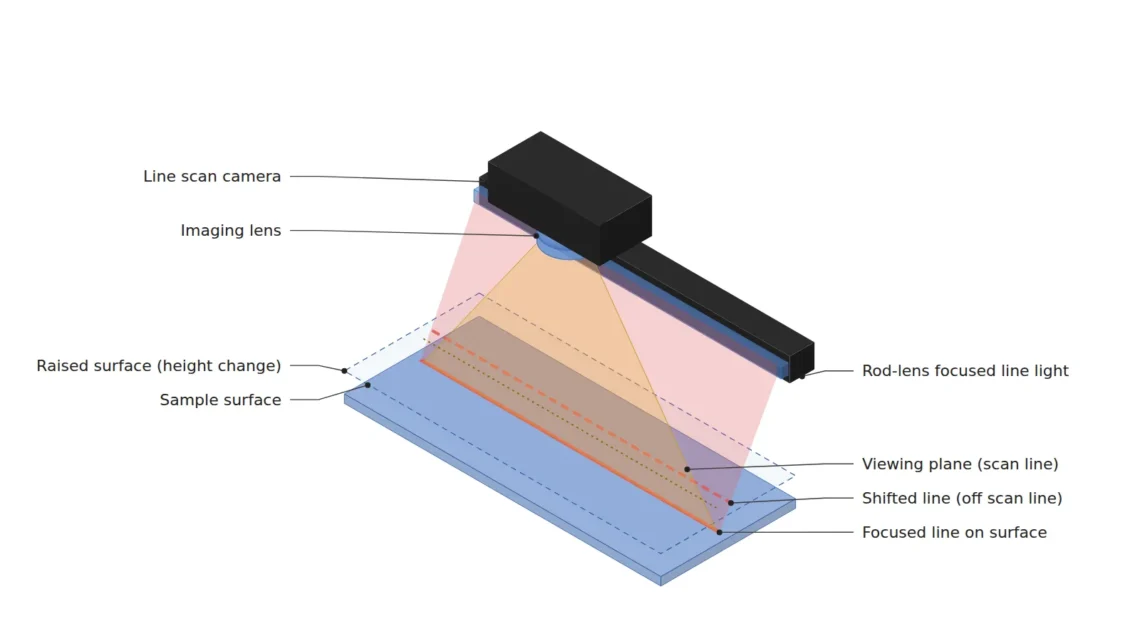
With the camera looking straight down and the light tilted θ from the normal, a panel rising or falling by Δz moves the spot the band lights by Δz × tanθ to the side. The line the camera sees stays put, so it ends up looking at the slope of the band instead of its center. It is the same as shining a flashlight across a desk at an angle and slipping a stack of paper under it: the patch of light shifts sideways.
Assume a band FWHM of 3 mm and a height wobble of ±2 mm: at a 30° angle of incidence the band slides 1.15 mm, and the irradiance on the line drops 34 % even before any blur. Lower the angle to 15° and the slide becomes 0.54 mm, with an 8.5 % drop. On top of that, the band widens as it leaves its set distance, so the real drop runs a little larger than these numbers.
1.15mm
how far 2 mm of height pushes the band at 30° incidence
34%
the resulting irradiance drop on the line, 3 mm band FWHM assumed
8.5%
the drop after lowering the angle to 15°
There is a price. With the camera vertical and the light at 15°, a surface tilted by only 7.5° sends specular reflection9 into the lens, while at 30° it holds out to 15°. On surfaces with a one-directional component, such as hairline metal, or on warped panels, lowering the angle raises the risk of glinting stripes by the same measure, so where this trade-off balances cannot be guaranteed before a sample test. Measures on the mechanical side that hold the height steady need a separate review.
A useful by-product comes out of this. The average brightness of a line in a defect-free stretch doubles as an indicator of height wobble. My approach would be to raise a hold signal, ahead of the decision, for any line whose average falls more than 10 % below the reference. At 15° the worst drop is 8.5 %, which stays inside this alarm; at 30°, the 34 % drop would keep the alarm ringing. The line average also dips a little when a defect passes, but on a 4,096 px line a defect four pixels wide moves the average by less than 0.1 %, so it does not get mixed up with height wobble.
Line light specs that protect a 250 μm scratch
Move the lens falloff, bar length and angle of incidence onto one spec sheet, and it looks like the table below. Pixel counts use one 73.2 μm pixel, and the lighting rows note where each number came from.
| Item | Value | Condition and basis | In plain words |
|---|---|---|---|
| ① Minimum defect size · surface scratch | 250 μm wide = 3.41 px (73.2 μm/px) | 300 mm ÷ 4,096 px; the defect whose margin shrinks first when edge SNR is 0.88 | A little over three pixels, so the edges decide |
| ① Minimum defect size · foreign matter and dents | 300 μm diameter = 4.10 px | blobs of 4 px or more | Four pixels are enough to catch |
| ① Minimum defect size · gloss stain | 2 mm = 27.3 px | judged by low-frequency brightness deviation | Wide stains are judged by brightness difference |
| ② Optical setup · line light | focused, 420 mm long (60 mm margin each side of the field), 3 mm band FWHM, 15° incidence | bar end droop 0.89 (light height 70 mm assumed), ends 1.3 times on surface irradiance | Use a bar shaped brighter at the ends |
| ② Optical setup · camera and lens | line sensor 4,096 px (7 μm), 35 mm, exposure around 45 μs | half field angle 20.5°, cos⁴θ = 0.77 at the ends | The lens takes 23 % off the ends |
| ② Optical setup · WD | about 401 mm (from principal plane) | measure that the light housing does not block the lens view; about 802 mm with a 70 mm lens | Measure the mounting height first |
| ③ Algorithm parameters · flat field | two-point correction with dark current and a white reference | only the few percent left after the light profile | Software trims only the last few percent |
| ③ Algorithm parameters · uniformity check | lengthwise brightness within ±5 % before correction | light profile × cos⁴θ measured on a white reference | It should be nearly flat before correction |
| ③ Algorithm parameters · height alarm | hold the decision when a line average falls more than 10 % below the reference | the worst 8.5 % drop at 15° stays inside the alarm | Warn first when the band slides |
| ③ Algorithm parameters · defect detection | scratch: line filter along the line, foreign matter: blobs of 4 px or more | retuned on good parts | Look for lines and dots separately |
The table shows that the tightest row is the 3.41-pixel scratch, and that edge SNR is what eats its margin first. Filling the ends with software gain alone means looking for a 3.41-pixel scratch at the edges with 12 % lower SNR, so in my judgment shaping the light profile is the way to protect this defect. The angle of incidence and the alarm level are tied together as well, so changing one means recalculating the other.
Surfaces that decide between focused and diffuse
Some surfaces clearly call for the opposite approach. If the panel height wavers widely, or the surface is warped and strongly glossy, the band slide and the specular stripes grow together, and a diffuse line light10 with a wide, soft band works better. The irradiance on the line drops a lot for the same power, so whether the signal still suffices at a 45 μs exposure has to be calculated alongside.
If there is enough light to accept an edge SNR of 0.88, running a uniform bar with flat-field correction alone, with no profile of its own, is cheaper; and with a narrow field or a long focal length the half field angle is small, the cos⁴θ falloff itself is small, and profile compensation gains almost nothing. The mix of diffuse and specular reflection and the actual spread of height wobble differ from product to product, so which way is right cannot be guaranteed before a sample test.
The person who works with this multiplication every day is the machine vision engineer in charge of line scan setups. For someone just learning, I recommend laying a bar light on white paper and photographing its ends and middle with a phone camera at the same exposure, to see with your own eyes where the ends start to droop. From the equipment budget side, a bar light with zoned current control costs more per unit, so the right move is to put that price difference and the cost of missing edge defects in one table and compare them. This article explains technology and is not investment advice. See our Disclaimer.
Field Note
If the line average brightness swells and dips at a steady interval, I would log the line average along a time axis and look at its period before suspecting the light power supply. If the period matches the rise and fall of the panel height and the drop is around 30 % at a 30° angle, as calculated for this setup, the light band is sliding sideways. In that case the angle goes down to about 15°, while each glossy product gets its own check for glinting stripes.
Field Checkpoints
With the line average log from the Field Note in hand, use the questions below to turn the line light into spec-sheet sentences.
- Is a WD of about 401 mm (35 mm lens, from the principal plane) secured by measurement, with the line light housing clear of the lens view? (distance from the lens front from the lens drawing)
- Have you first separated matte surfaces that scatter evenly from hairline or glossy surfaces with a one-directional component? (the fork between focused and diffuse)
- Is the bar long enough beyond the field on both sides? (a bar of the same length droops to 0.51 at the ends)
- Have you imaged a white reference before correction to separate the lens falloff from the light profile along the length? (target ±5 % before correction)
- Have you measured the actual height wobble and calculated the band slide as Δz × tanθ?
- Is the alarm for a drop in line average brightness set to put the decision on hold? (10 % below the reference)
Glossary
- [1] Contrast contrast
A measure of how clearly a defect stands apart from the background in brightness. That difference must be comfortably larger than the noise for a decision to hold. ↩ - [2] WD working distance
The distance between the lens and the inspected surface. The values here are thin-lens numbers from the lens principal plane, so the clearance from the lens front is matched again on the lens drawing. ↩ - [3] Cosine fourth law cos⁴ law, natural vignetting
The natural falloff in which the brightness of light through a lens drops with the fourth power of the cosine of the off-axis angle. Stopping down does not remove it. ↩ - [4] Half field angle half field angle
The angle between the optical axis and the line of sight to the edge of the field. It grows with a wider field or a shorter focal length. ↩ - [5] Flat-field correction flat-field correction
A correction that sets a gain for every pixel from an image of a white reference, flattening the image brightness. It evens out brightness but cannot bring back lost photons. ↩ - [6] Shot noise shot noise
Noise from the number of light particles reaching the sensor varying slightly every time. Its size follows the square root of the signal. ↩ - [7] Signal-to-noise ratio signal-to-noise ratio, SNR
The size of the signal divided by the size of the noise. The larger it is, the easier it is to separate defects from noise. ↩ - [8] Focused line light focused line light
A light that gathers LED output into a band a few mm wide with a rod lens. The band is bright, but it keeps its width only at a set distance. ↩ - [9] Specular reflection specular reflection
Reflection in which light bounces off a smooth surface in one direction only, at the same angle it came in. If the lens sits in that direction, the light itself shows up in the image. ↩ - [10] Diffuse line light diffuse line light
A line light that sends broad, soft light through a diffuser. It tolerates height changes and gloss, at the cost of lower irradiance for the same power. ↩
References
- Formulas: pixel resolution = field of view ÷ pixel count, magnification m = sensor length ÷ field of view, object distance = f × (1 + 1/m), half field angle θ = atan(field ÷ 2 ÷ object distance), relative illumination ≈ cos⁴θ, shot-noise SNR ∝ √signal, band slide = Δz × tanθ, irradiance on the line = exp(−slide² ÷ 2σ²) (σ = FWHM ÷ 2.355), bar end droop from integrating a Lambertian line source along its length
- Assumptions: line sensor 4,096 px (7 μm pixels), 35 mm lens, 300 mm field, 45 μs exposure, 3 mm band FWHM, height wobble ±2 mm, 70 mm between light and surface, bar margins of 0, 30 and 60 mm on each side
- Vignetting (natural vignetting and the cos⁴ law), Wikipedia. en.wikipedia.org/wiki/Vignetting
Related reading — Flat-Field Correction Gain Amplifies Noise Along with Uneven Light · In the Age of 8K Line-Scan Cameras, the Lens Still Sets the Ceiling on Inspection Resolution · How Much Closer Does a CIS Sit Than a Line Scan Camera?

Noctvision
An engineer who has handled mechanical design and project management for production equipment since 2005. Here I work through the cameras, lenses and lighting that go into equipment with formulas and public data, and record the assumptions and sources alongside the numbers.


You May Also Like
A Depth Camera’s Error Grows with the Square of Distance
In 2D/3D Fusion Inspection, the Bottleneck Is Lighting Interference