Why Are the Ends of a Line Scan Image Dark? — Choosing Focused or Diffuse Line Lights and Compensating the Cosine-Fourth Falloff
LIGHTING / OPTICS
When you receive line scan inspection images, it is common for the center to be bright and both ends dark, or for the entire image to darken and brighten at some moment like a stripe pattern. It is easy to suspect the camera and lens first, but a large share of the causes lies in the line light that illuminates a single narrow line. Because line scan builds the image one line at a time, the illuminance distribution and stability of that one line determine the contrast of the whole image.
Left unaddressed, the cost shows up first at both ends. When the signal at the edges is low, edge defects are missed at the same threshold, and lowering the threshold to suit the edges increases overdetection in the center. On top of that, when the product height fluctuates and the focused line drifts off the scan line, a defect-free section darkens entirely, and false rejects occur in succession. The higher the line speed, the longer the stretch of false decisions a single fluctuation creates.
The solution is to design the line light not by “brightness” but by distribution and height tolerance. Whether to use a focused (rod lens) or diffuse type is decided by the trade-off between required illuminance and product height variation, and the cosine-fourth light falloff of the lens is compensated in advance with the lengthwise profile of the light. Then the incidence angle of the focused line is set to match the height variation.
The uniformity of a line scan image is the product of the lighting profile and the lens light falloff.
1. Focused vs. Diffuse — Trading Illuminance for Height Tolerance
Point. Choosing between focused and diffuse line lights is a trade: gaining illuminance in exchange for giving up height tolerance.
Reason. Line scan cameras have short line periods, so exposure time is limited to the order of tens of µs. To get enough signal within this short exposure, high illuminance is needed on the scan line, and a focused light that gathers LED light into a narrow line with a rod lens meets this requirement. The price is that the focused line is narrow and keeps that width only at the specified focal distance. A diffuse light has a wide, soft line and is tolerant of height variation and glossy surfaces, but at the same power its illuminance on the scan line is much lower.
Example. At a line rate of 20 kHz, the line period is 50 µs, and the exposure must be set at 45 µs or less. Viewing a 300 mm FOV with a 4096 px line sensor gives a pixel resolution of 73.2 µm/px, so the product travel speed for square pixels is about 1.46 m/s (calculated). Under these conditions, a surface dominated by diffuse reflection, such as a matte molded sheet, gets illuminance margin from a focused light, while a surface mixing diffuse and specular reflection, such as hairline-finished metal, may produce fewer stripes with a diffuse light. Which is better for a given surface cannot be confirmed before sample testing.
Point. A line light selection sheet should list, on the same line as “required illuminance”, “how much the product height fluctuates”.
2. The Cosine-Fourth Law — Lengthwise Uniformity Is Not Just a Lighting Problem
Point. Even if the lighting is perfectly uniform along its length, both ends of the image get darker because of the lens.
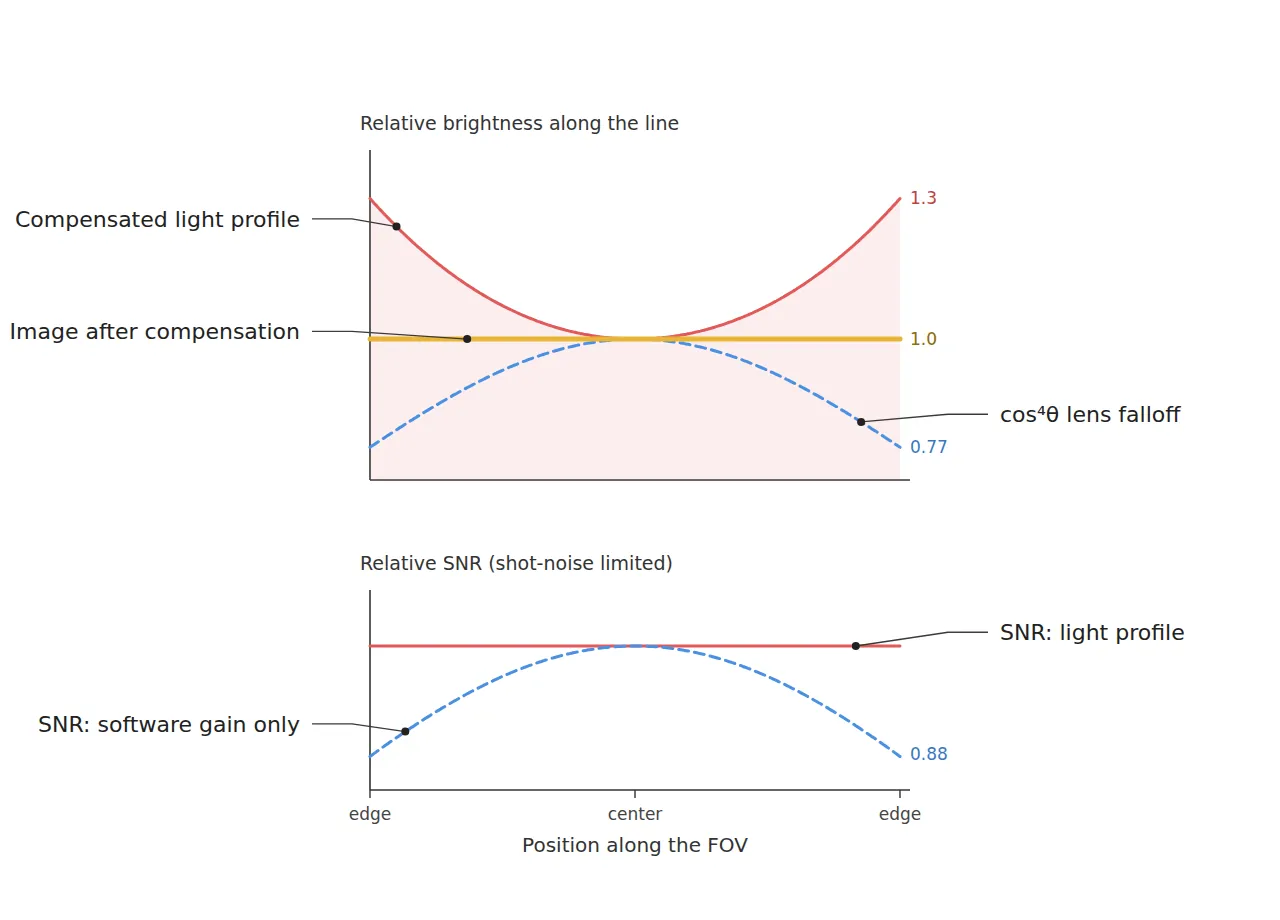
Reason. The image-plane illuminance through a lens falls roughly as cos4θ with the field angle θ relative to the optical axis. This is the cosine-fourth law, a natural light falloff that appears even without mechanical vignetting. Because a line scan FOV is long in one direction, the field angle easily becomes large, so this effect is especially strong. Therefore, the lengthwise uniformity of the image must be calculated as the product of the lighting profile and cos4θ.
Example. Viewing a 300 mm FOV with a 35 mm focal length lens, the object distance is about 401 mm (calculated), and the half field angle at the edge is tanθ = 150 ÷ 401 ≈ 0.374, or about 20.5°. Since cos4(20.5°) ≈ 0.77, the edge signal is about 77% of the center. Raising it with a software flat-field gain of 1.3 matches the brightness, but by shot noise the edge SNR remains at √0.77 ≈ 0.88, about 12% lower than the center. In contrast, if the light itself is designed with a profile about 1.3 times brighter at both ends, more photons actually arrive at the edges, so the SNR is recovered as well.
Point. Flat-field correction only matches brightness; it cannot bring back lost photons. One must not assume software correction alone can fully cover a hardware light falloff; the right order is to compensate with the lighting profile first and trim only the residue with flat-field correction.
3. Height Variation and Focus Departure — The Bright Line Walks Off the Scan Line
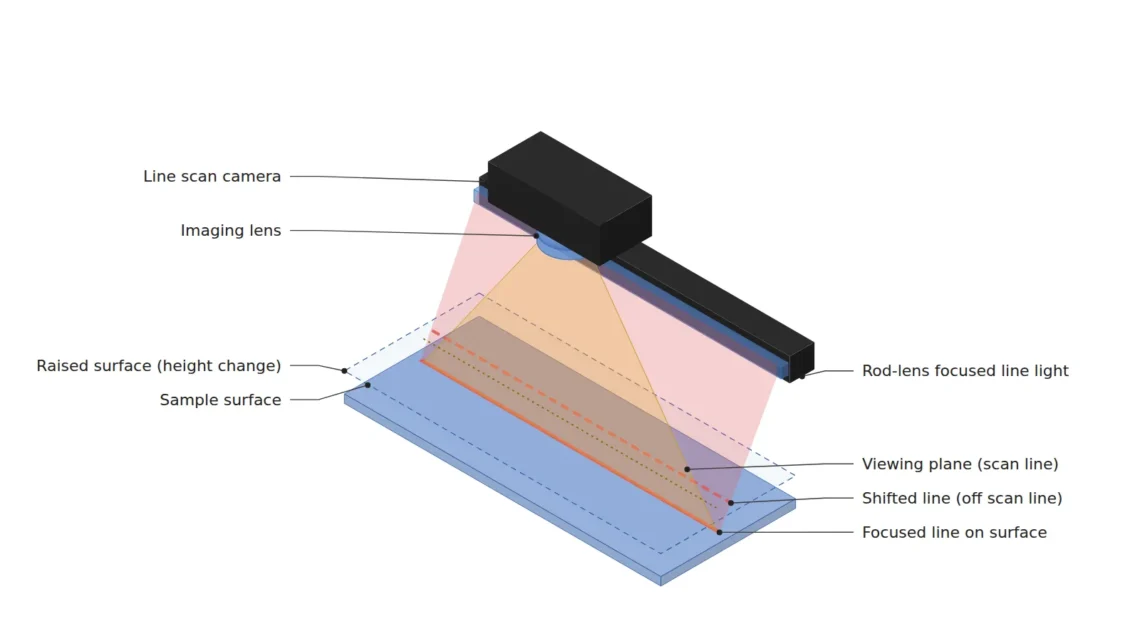
Point. With obliquely incident focused lighting, the first-order effect of height variation is not blurring but a lateral shift of the line.
Reason. When the camera looks straight down and the light is tilted by θ from the normal, a rise or fall of the sample surface by Δz moves the position lit by the focused line sideways by Δz × tanθ. The camera’s scan line stays where it is, so the scan line ends up looking not at the center of the focused line but at its sloped edge. The blurring effect, in which the line widens as it leaves the focal distance, is superimposed on top of this.
Example. If a focused line with a Gaussian profile of 3 mm line width (FWHM) is projected at a 30° incidence angle and the height variation is ±2 mm, the lateral shift is 2 × tan30° ≈ 1.15 mm. With σ = 3 ÷ 2.355 ≈ 1.27 mm, the illuminance on the scan line is exp(−1.15² ÷ (2 × 1.27²)) ≈ 0.66, a drop of about 34% even before blurring. Lowering the incidence angle to 15° reduces the shift to about 0.54 mm and the illuminance drop to about 9%. However, reducing the incidence angle raises the risk of surface specular reflection entering the camera, so this trade-off must also be checked on glossy surfaces.
Point. The practical insight here is that the line mean brightness is itself a height variation sensor. When the line mean brightness in a defect-free section drops by more than a set ratio, raising a focused-line departure alarm before the decision is the cheapest way to stop a chain of false decisions.
The enemy of a focused line is not blurring but a lateral shift of Δz × tanθ.
4. Core Framework — Matching Table
| Category | Item | Specification / Parameter | Basis & Notes |
|---|---|---|---|
| ① Minimum defect size | Surface scratch | Width 250 µm or more | Design assumption. About 3.4 px at 73.2 µm/px |
| ① Minimum defect size | Foreign matter / dent | Diameter 300 µm or more | Design assumption. About 4.1 px |
| ① Minimum defect size | Gloss stain | 2 mm or more | Design assumption. About 27 px, judged by low-frequency brightness deviation |
| ② Optical setup | Line light | Focused (rod lens), length 420 mm, line width (FWHM) 3 mm, incidence angle 15° | Design assumption. 60 mm margin on each side of the FOV, compensation profile about 1.3 times at both ends |
| ② Optical setup | Camera & lens | Line sensor 4096 px (7 µm pixels), focal length 35 mm | Design assumption. Sensor length about 28.7 mm, line rate 20 kHz |
| ② Optical setup | WD (working distance) | 380 mm or more must be secured | Thin-lens object distance about 401 mm (calculated). Measure including line light housing and field-of-view interference |
| ② Optical setup | FOV & pixel resolution | FOV 300 mm, 73.2 µm/px | Calculated as 300 mm ÷ 4096 px |
| ② Optical setup | Light falloff | Half field angle about 20.5°, edge cos4θ ≈ 0.77 | Calculated. Mechanical vignetting excluded |
| ③ Algorithm | Flat-field | Per-pixel two-point correction with dark current and white reference plate | Corrects only the residue after lighting profile compensation |
| ③ Algorithm | Uniformity criterion | Lengthwise image brightness within ±5% before flat-field correction | Design assumption. Result of lighting profile × cos4θ measured with a white reference plate |
| ③ Algorithm | Defect detection | Scratch: line filter along the scan direction; foreign matter: blob ≥ 4 px | Design assumption. Retuned against good parts |
| ③ Algorithm | Height departure alarm | Hold decisions when the line mean brightness drops by 10% or more from the reference | Design assumption. Early detection of focused-line departure |
Table implication. 300 mm ÷ 4096 px gives a pixel resolution of 73.2 µm/px, and the smallest defect, a 250 µm scratch, barely clears the detection premise at about 3.4 px. Because this margin is small, software-only compensation, which cuts the edge SNR by about 12%, directly lowers the detection rate of scratches at the edges. Also, at a 15° incidence angle the illuminance drop from ±2 mm height variation is about 9%, staying inside the 10% height departure alarm threshold, whereas at 30° it would be about 34% and the alarm would sound constantly. The incidence angle and the alarm threshold must be set as a pair.
5. When the Opposite Approach Wins
- When the product height variation is large or the surface is curved or highly glossy: Focused-line departure and specular stripes grow. A diffuse line light with a wide line width is favorable.
- When there is enough light margin to accept the edge SNR loss: Operating with uniform lighting and flat-field correction alone, without designing a separate lighting profile, is more economical.
- When the field angle is small because the FOV is narrow or the focal length is long: With a small half field angle, the cos4θ falloff is negligible, so profile compensation brings almost no gain.
The ratio of diffuse to specular reflection on the surface and the actual distribution of height variation differ greatly with product and process conditions, so the outcome cannot be confirmed before sample testing.
Field Note
On a continuous strip line, I once tracked down a problem where the line scan image darkened periodically. At first I suspected the lighting power supply, but when I logged the line mean brightness, it had exactly the same period as a slight lift of the product as it passed the roll section. The focused light, installed at a 30° incidence angle, was moving sideways by the amount of the height variation. After lowering the incidence angle to around 15° and switching to a light with a profile brighter at both ends, the image deviation shrank, but on highly glossy items new specular stripes appeared, so I now manage the angle separately for each item.
Field Checkpoints
- Is a WD of 380 mm or more secured by actual measurement? — Check including whether the line light housing blocks the lens field of view.
- Have you first identified the target surface material and reflectance? — The choice between focused and diffuse types depends on whether diffuse reflection dominates or specular reflection is mixed in.
- Is the light sufficiently longer than the FOV? — The illuminance roll-off zones at both ends of the light must not fall inside the FOV.
- Have you measured the lengthwise illuminance distribution before correction with a white reference plate, separating the cos4θ falloff from the lighting profile?
- Have you measured the actual product height variation and calculated the focused-line shift as Δz × tanθ?
- Is the line mean brightness drop alarm set to act before the decision?

Noctvision
A machine vision engineer who fits cameras, lenses, lighting, and image-processing algorithms together for a living. Years spent on continuous production lines, vibration, heat, and dust included, working through diffuse reflection, contrast, and resolution differences too fine for a spec sheet to capture inform every post here, closing the gap between theory and the shop floor. Off duty, that same eye for light and lenses goes into repairing fully mechanical vintage film cameras.


You May Also Like
2D/3D Fusion Inspection: The Bottleneck Is Lighting Interference
Dark-Field Illumination and Edge AI Defect Classification: A New Baseline for Specular-Surface Inspection