2D/3D Fusion Inspection: The Bottleneck Is Lighting Interference
In a fusion inspection setup where a 2D camera and a 3D profiler sit side by side on one station, the first design decision isn’t the camera — it’s the wavelength. The moment both channels’ lighting shares the same wavelength band, no matter how well you pick everything else, the detection rate won’t come out as designed on paper.
Here’s what actually happens. The white-light component of the 2D illumination rides straight into the 3D profiler’s receiving band as background light, and the SNR of the laser-line peak detection degrades. Once a 40 µm step starts getting buried in noise, the usual next move is time-division acquisition — alternating captures between the two channels.
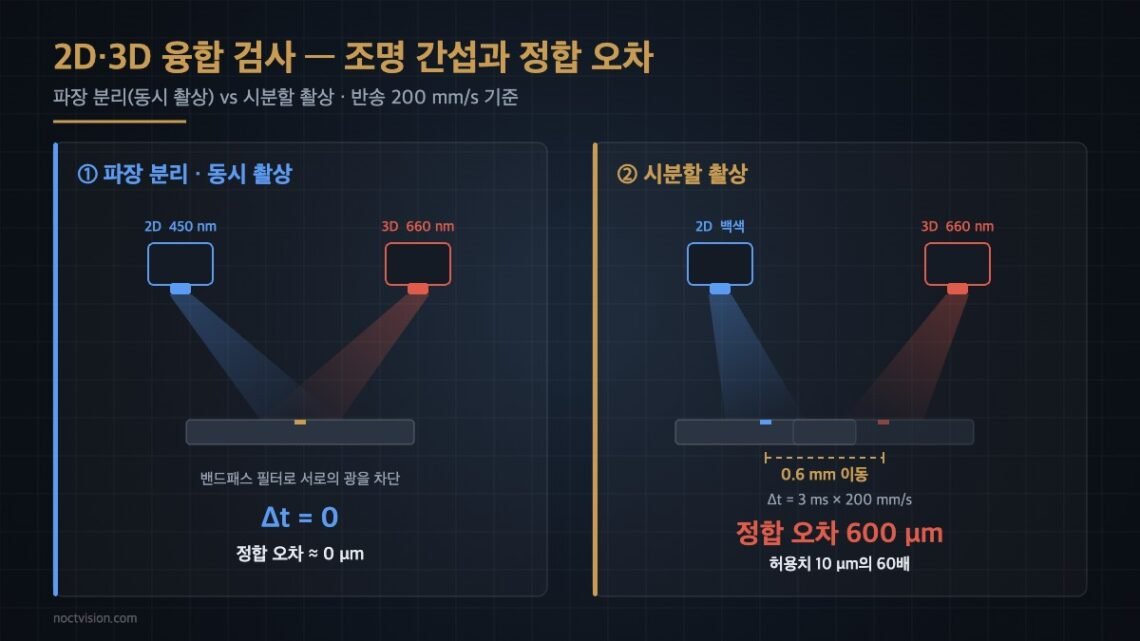
But the moment you switch to time-division, something bigger breaks. The distance the target moves between the two captures shows up directly as coordinate-registration error. The fix meant to prevent missed detections comes back in a different shape: misregistration. The leakage cost stays the same — only the root cause gets harder to trace.
The Solution Is Upstream of Camera Selection: Wavelength Planning
The lighting on a fusion station has to be treated not as two separate systems but as one optical system. Assign the 2D and 3D channels non-overlapping wavelengths, and put a band-pass filter in front of each camera that passes only its own band. Set up this way, the two channels can capture simultaneously without ever seeing each other.
The reason is simple. The interference is, at its core, wavelength overlap, so separating wavelengths eliminates the interference itself. By contrast, an approach that tunes only the peak-detection algorithm without separating wavelengths has an obvious ceiling. A signal already buried in background light isn’t recovered by post-processing. The filter has to be applied at the optical stage first, and the algorithm comes after.
Check This First — Surface Material and Reflectivity
Before assigning wavelengths, the target’s surface condition has to be checked first. A surface dominated by diffuse reflection, like a matte ABS molded part, is mostly resolved by wavelength separation alone. A surface with strong specular reflection — a glossy molded surface or a plated PCB pad — is a different story.
On a specular surface, multiple reflection can occur, where the laser line bounces once more off the interior of the part or an adjacent surface before returning. Since this component shares the same wavelength as the 3D channel, the band-pass filter can’t screen it out. Whether detection is even possible on a surface like this cannot be confirmed before sample testing. Until the profile cross-section has been checked directly on a physical specimen, the specs below are only a starting point, not a final value.
① Split the Minimum Defect Size to Detect Across Both Channels From the Start
A common mistake in fusion setups is writing down a single detection target. Since the defects a 2D channel handles and the defects a 3D channel handles are physically different quantities, the minimum size needs to be defined separately for each. Take molded-part inspection as an example: 2D’s baseline is the width of a surface scratch or foreign matter, while 3D’s baseline is the height of a sink mark or step.
② Optical Setup and ③ Algorithm Parameters Matching Table
| Channel | ① Minimum defect size to detect | ② Optical setup (lighting/lens/WD) | ③ Algorithm parameters |
|---|---|---|---|
| 2D appearance Scratch/foreign matter |
Width 30 µm (3.8 px on a 3-px rule basis) |
Blue 450 nm coaxial epi-illumination + low-angle ring combined 20 MP · 5120 px, FOV 40 mm → 7.8 µm/px Focal length 50 mm, magnification 0.44x, WD approx. 145 mm 450 nm band-pass on the camera side (stop-band OD4 or higher) |
Minimum blob area 12 px ΔGV threshold 18 Directional filter, 0°/90° 2-channel |
| 3D shape Sink mark/step |
Height variation 40 µm | Red 660 nm laser line, triangulation angle 30° Profile 2048 point / 40 mm → 19.5 µm/point Z repeatability 2 µm, WD approx. 150 mm (center of measurement range) 660 nm band-pass on the camera side |
Peak detection: centroid method Effective peak width 3–9 px Residual threshold −40 µm after plane fitting |
| Fusion registration | Registration tolerance 10 µm (1/3 of 2D’s 30 µm minimum defect) |
One-time calibration with a dot-grid calibration plate Measured optical-axis offset between the two channels |
6-parameter affine transform Pass at RMS residual ≤ 4 px |
The row that’s actually tightest in this table isn’t the lens or the sensor — it’s the third row. The 10 µm registration tolerance only holds when both channels are looking at the same instant, and it collapses the moment capture timing drifts, regardless of the optical specs.
Choose Time-Division and Registration Error Jumps 60x
The numbers make the decision quick. Combine LED-strobe turn-off response and sensor readout and put the interval Δt between the two captures at 3 ms, with the target moving at 200 mm/s. That gives a displacement of 0.6 mm, or 600 µm. That’s 60x the 10 µm tolerance, and on a 7.8 µm/px basis, it’s a 77-pixel misalignment.
Conversely, to hold 10 µm, speed would need to stay at or below 10 µm ÷ 3 ms = 3.3 mm/s — effectively a stationary capture. In short, time-division isn’t a technique for avoiding lighting interference — it’s a decision to switch the transport method to stop-and-index. If this sentence is missing from the inspection machine’s spec sheet, the line-takt discussion will inevitably come back around later. That said, the transport mechanism’s control itself is outside this review’s scope and needs separate consideration.
When Time-Division Is Actually Favorable
Wavelength separation isn’t always the right answer. Under the following three conditions, time-division acquisition is actually the more reasonable choice.
- When color judgment is required — if the goal is color-difference or discoloration inspection, you can’t give up a white light source, so wavelength separation doesn’t work.
- Stop-and-index transport lines — if displacement during Δt is zero, the registration-error term disappears entirely. Here, time-division is the optically cleanest option.
- Reusing existing assets — when an already-owned 3D profiler’s laser wavelength overlaps the 2D lighting and there’s no budget to replace it.
All three conditions carry the same caveat. On a strongly specular surface, multiple-reflection components remain whether you choose time-division or wavelength separation, so checking a specimen comes before choosing a configuration. To repeat: this cannot be confirmed before sample testing.
Why This Decision Will Come Up More Often Going Forward
Machine-vision camera market outlooks project the overall market growing from $6.79 billion in 2025 to $20.9 billion by 2035, an 11.89% CAGR, while the 3D camera segment is projected at 15.83% — well above the market average. Combine that with area-scan still holding a 56.4% share, and the interpretation becomes clear. 3D isn’t replacing 2D — configurations where both channels sit on one station are becoming more common.
If that’s the direction, the first page of setup review going forward needs to be a wavelength layout diagram, not a camera spec sheet. You can pick a sensor from a catalog, but whether two lighting systems can coexist in the same space is something nobody can confirm for you until you’ve drawn it out.
Field Checkpoints
- Is WD secured? — Measure the WD of the 2D lens and the 3D profiler separately. In the example above they differ by 5 mm (145 mm vs. 150 mm); if both values don’t fit within the jig’s height-adjustment range at once, one side will inevitably lose focus.
- Band-pass filter stop-band OD — Don’t select based on the pass band alone. An OD2-class filter only cuts the counterpart channel’s light to 1/100, leaving background light behind. Confirm OD4 or higher as the baseline.
- Measure registration error — Capture a dot-grid calibration plate with both channels and record the RMS residual in pixels. This becomes your comparison baseline once vibration or thermal drift throws registration off later.
- Measure Δt — For a time-division setup, measure the actual Δt — including lighting turn-off response and trigger delay — with an oscilloscope. It usually differs from the catalog value.
References
Machine-vision camera market size and segment growth rates — SNS Insider, Machine Vision Camera Market Size 2026-2035 (2026-08-17)
The Defect Zone You Miss When You Switch to 3D Inspection
How to Handle Imaging on Highly Reflective Surfaces


You May Also Like
Software-Defined Lighting: One Head, Switching Between Dark-Field and Coaxial Illumination
Six Machine-Vision Lighting Methods and How to Choose