Why Does Yesterday’s Threshold Miss Today? — Managing LED Light Output Degradation and Temperature Drift
LIGHTING / RELIABILITY
An inspection recipe is usually built on the illumination brightness of the setup day. The threshold, the exposure and the golden sample images are all fixed to that day’s light level. But the light output of an LED illuminator declines gradually as operating hours accumulate, and even within a single day the brightness rises and falls with the junction temperature. The recipe stays the same while the light the recipe assumed changes.
This change is dangerous because it is quiet. In an inspection that catches bright defects with an absolute gray-level threshold, a 15 % drop in light output pulls the defect signal below the threshold and the defect passes straight through. There is no alarm and no rise in false detections. The yield figure actually looks better, and the problem surfaces only after it comes back from the customer’s incoming inspection or as a field failure. By then, several weeks of production have become subject to traceability.
The solution is not to assume that the illumination is “always the same” but to treat it as something to be measured. Place a reference patch inside the FOV to monitor the light level every frame, reduce the width of the drift itself with constant-current drive and heat dissipation, and back-calculate the recalibration interval from the observed degradation rate. Only when these three work together does the threshold keep the meaning it had on the setup day.
Defect escapes caused by illumination degradation advance first in the direction where no alarm sounds.
1. In Which Direction Does Light Output Loss Break an Inspection
Point. Depending on defect polarity and threshold method, the effect of light loss shows up as either false detection or missed detection, and the dangerous one is missed detection.
Reason. Image gray levels are roughly proportional to the illumination level. When the light level becomes k times, the background and defect signals both become k times, but a threshold fixed in absolute gray levels does not move. If a bright defect on a dark background is caught as “gray level > threshold”, light loss drags the defect signal toward the threshold and creates missed detections. Conversely, in an inspection that catches dark defects on a bright background, the background approaches the threshold and false detections increase. Operators notice false detections first, but nobody notices missed detections.
Example. Assume inspection for white foreign particles on a glossy black molded housing. The background is about 120 gray levels, the particle about 210, and the threshold 180. The margin between the particle signal and the threshold is (210 − 180) ÷ 210 ≈ 14.3 %. If light output falls by 10 %, the particle is at 189 and still detected, but at a 15 % drop it becomes 178.5 and falls below the threshold. Glossy resin has a large specular component, so the gray levels of particle and background are themselves sensitive to illumination angle; this margin therefore cannot be confirmed before sample testing and must be re-established by measurement.
Point. The alarm limit for illumination monitoring must be placed inside the threshold margin. In this example, the −10 % stop limit has to be designed to trigger before the 14.3 % margin is used up in order to prevent quiet escapes.
2. Reference Patch Monitoring — The Shape of the Trend Names the Cause
Point. A single reference patch fixed in a corner of the FOV becomes the cheapest light meter, measuring the illumination state every frame.
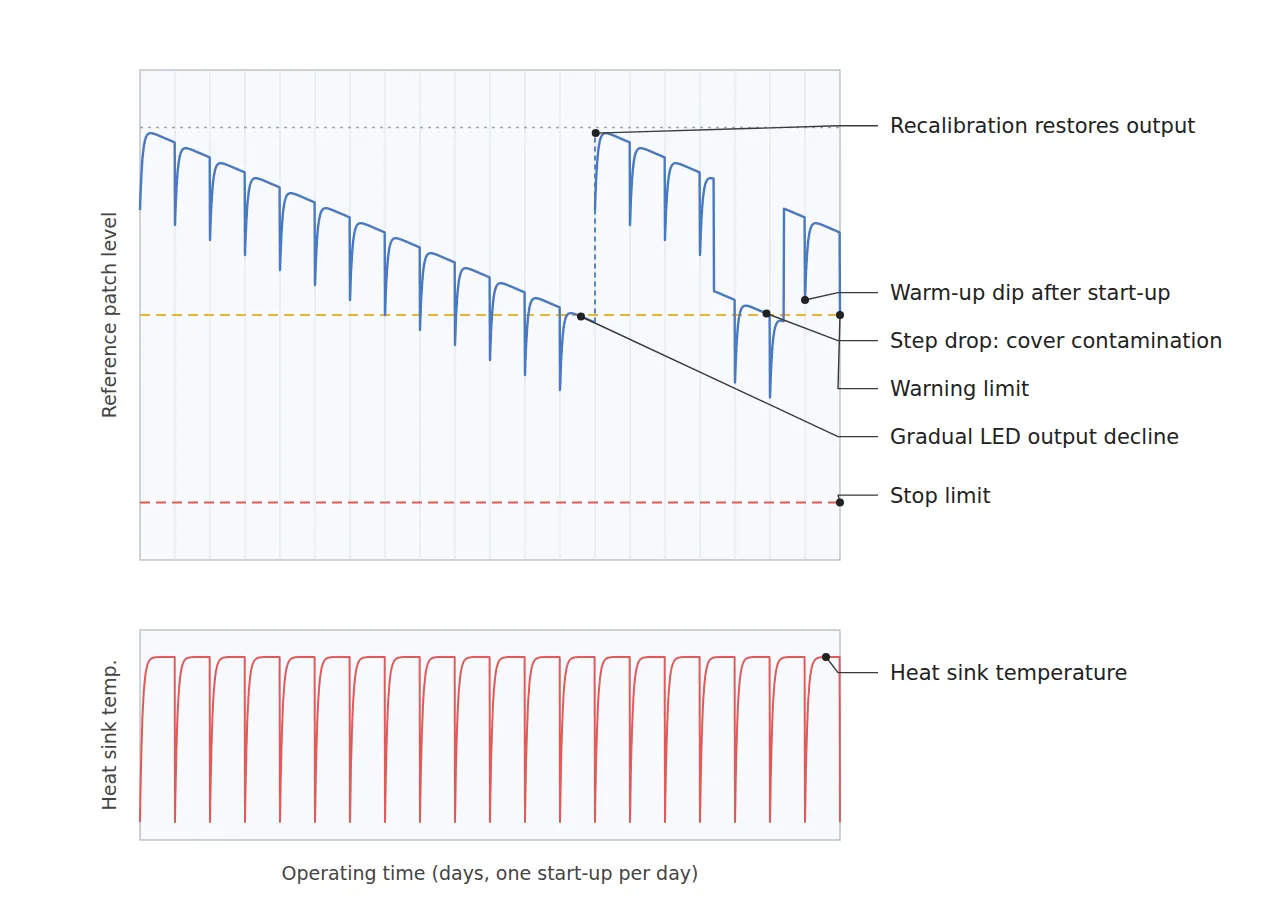
Reason. The reference patch passes through the same illumination, lens and sensor path as the product, so it reveals in one number not only illumination degradation but also cover glass contamination and changes in exposure settings. Using a diffuse gray patch of known reflectance (about 50 %, design assumption) reduces the influence of the specular component and keeps the gray level in a mid range, away from saturation or the floor. Recording the patch mean as a ratio to its reference value turns it into a control chart by itself.
Example. In practice, what matters more than the value is the shape of the trend. A gentle slope that declines monotonically over several weeks is typical of LED light output degradation. A pattern that drops like a step at some point and then stays there should raise suspicion of lens cover contamination or a change in illumination position. A sawtooth that is low right after each daily start-up and recovers over tens of minutes is the thermal warm-up interval. Distinguishing these three shapes decides whether to replace the illuminator, clean the cover, or delay the start of inspection after start-up.
Point. The reference patch should be designed as a cause diagnoser. The three patterns can be told apart only when heat sink temperature and elapsed operating time are recorded on the same time axis as the patch value.
3. Constant-Current Drive, Heat Dissipation and Recalibration Interval Design
Point. Drift does not end with monitoring. Narrow its width with the drive method and heat dissipation, and recalibrate the remaining degradation at a calculated interval.
Reason. The forward voltage of an LED decreases as the junction temperature rises. Under constant-voltage drive, this increases the current, and the increased current in turn raises heat, creating a feedback loop that makes light output unstable. Constant-current drive fixes the current and breaks this feedback. However, even at the same current, light output falls as the junction temperature rises, so a thermal design that holds the heat sink temperature within a fixed range is also required. Lowering the duty to 10 % or less with strobe drive greatly reduces average heat generation as well.
Example. The recalibration interval is set by calculation, not by feel. Set the warning limit at −5 %, and observe the degradation rate from the patch record for the first 4 weeks of operation. If the observed value is 1 % per week, it takes 5 weeks to reach the warning limit; multiplying by a safety factor of 0.5 gives 2.5 weeks, which is set to a 2-week interval for operational convenience. At recalibration, restore the light output by bringing the illumination current back, then re-acquire the reference patch baseline and the flat-field reference. In addition, right after start-up, start inspection only after the patch rate of change has settled below 0.5 % per 5 minutes.
Point. If light loss keeps being covered by software normalization alone, noise grows by the normalization gain, so the principle is to restore light output in hardware and use normalization only for the small residual between recalibrations.
4. Core Framework — Matching Table
| Category | Item | Specification / Parameter | Basis & Notes |
|---|---|---|---|
| ① Minimum defect size | White particle on glossy black molded housing | Diameter 100 µm or more | Design assumption. About 3.1 px at 32.7 µm/px |
| ① Minimum defect size | Linear scratch that appears bright | Length 500 µm or more | Design assumption. About 15 px long |
| ① Minimum defect size | Short shot (incomplete molding) | 1,000 µm or more | Design assumption. About 31 px, relatively insensitive to light level change |
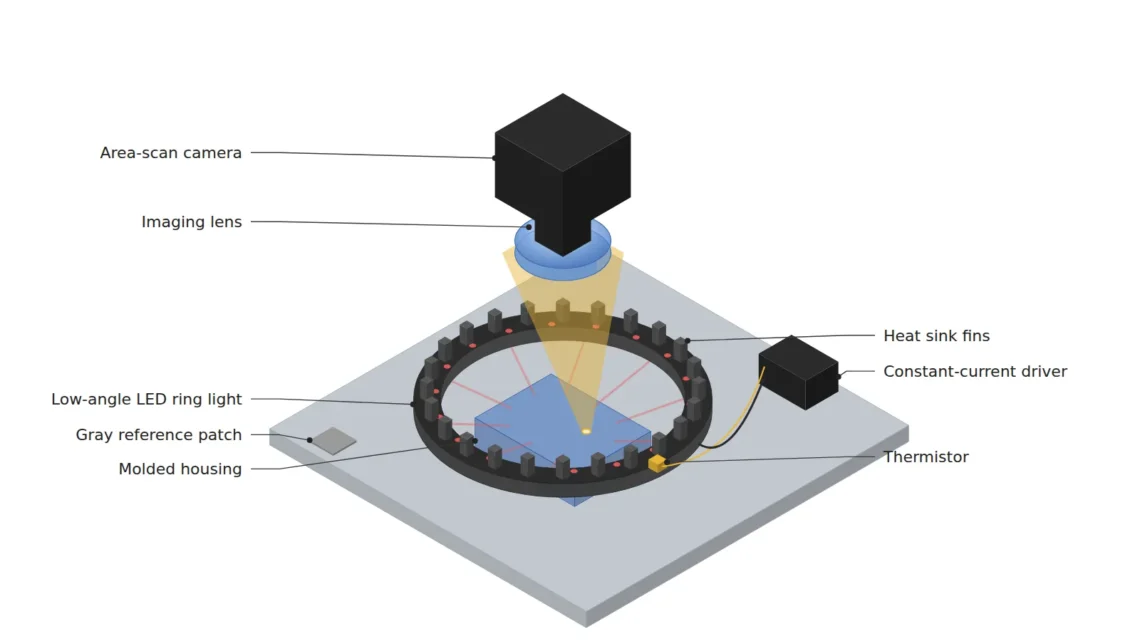
| ② Optical setup | Illumination | Low-angle white LED ring light, constant-current strobe, duty 10 % or less | Constant-voltage drive excluded (breaks thermal feedback) |
| ② Optical setup | Heat dissipation & temperature monitoring | Heat sink held at 50 °C or below, thermistor logging | Design assumption. Logged on the same time axis as the patch value |
| ② Optical setup | Camera & lens | 5 MP 2448 × 2048 px (3.45 µm pixel), focal length 25 mm | Magnification about 0.106 |
| ② Optical setup | WD (working distance) | 250 mm or more must be secured | Thin-lens object distance about 262 mm. Measure including ring light housing height |
| ② Optical setup | FOV & pixel resolution | 80 mm × 67 mm, about 32.7 µm/px | 80 ÷ 2448 ≈ 32.7, 67 ÷ 2048 ≈ 32.7 |
| ② Optical setup | Reference patch | Diffuse gray (reflectance about 50 %) 5 mm × 5 mm, fixed in an FOV corner | Light level measured as the mean of about 150 × 150 px |
| ③ Algorithm | Decision threshold | Background about 120, particle about 210, threshold 180 gray levels | Design assumption. Threshold margin 14.3 % |
| ③ Algorithm | Patch normalization | Image × (patch baseline ÷ current patch mean), gain limit 1.11 | 1 ÷ 0.9 ≈ 1.11, consistent with the −10 % limit |
| ③ Algorithm | Drift limits & warm-up | −5 % warning, −10 % stop / start inspection when rate of change is below 0.5 %/5 min | Design assumption. Stop limit placed inside the threshold margin |
| ③ Algorithm | Recalibration interval | 5 % ÷ observed degradation rate × 0.5 | Assuming 1 % per week observed: 2.5 weeks → 2-week interval |
Table implication. At 32.7 µm/px, a 100 µm particle occupies about 3.1 px and sits at the detection floor, so when light loss shrinks the signal, the gray-level margin collapses before size does. Because the −10 % stop limit lies inside the 14.3 % threshold margin, the line stops before a quiet miss occurs, and the normalization gain limit of 1.11 is tied to the same −10 %, so noise amplification never exceeds 11 %. The key takeaway from this table is that alarm limits must be back-calculated from the threshold margin.
5. When the Opposite Approach Wins
- Inspections with very large defect contrast that use a relative threshold: Judging by ratio to the background cancels out light level change, so periodic checks without a reference patch may be sufficient.
- Intermittent inspections with very short operating time: A station that is on for only tens of minutes a day accumulates degradation slowly, so scheduled annual replacement may be more economical than a monitoring system.
- Cases with no space for a patch inside the FOV: Monitoring illumination output directly with a separate photodiode is better. However, this method cannot catch lens or cover contamination.
For targets where specular and diffuse reflection mix, such as glossy resin or machined metal surfaces, the gray-level response to light level change can deviate from linear, so this cannot be confirmed before sample testing.
Field Note
In appearance inspection of black housings on a high-speed assembly line, the count of detected white particles dropped noticeably about two months after setup. The first interpretation was that the process had improved, but when the golden sample was re-imaged, the particle gray level had come down to just above the threshold. The cause appeared to be constant-voltage-driven illumination combined with a blocked heat dissipation path. After switching to a constant-current driver, attaching a gray patch to an FOV corner and setting a −10 % stop limit, I have not seen a similar case, but degradation rates differ from line to line, so I still re-derive the recalibration interval from the first 4 weeks of records each time.
Field Checkpoints
- Is a WD of 250 mm or more secured by measurement — verify including the ring light housing and the heat sink height.
- Has the surface material and reflectance of the target been confirmed first — glossy resin changes the gray-level response to light level because of its specular component.
- Is the illumination driven by constant current, and is the heat sink temperature being logged.
- Is a diffuse gray reference patch fixed inside the FOV, with its mean value recorded every frame.
- Is the stop limit (−10 %) inside the decision threshold margin (14.3 % in this example).
- Was the recalibration interval calculated from the actually observed degradation rate, and is a warm-up condition after start-up included in the recipe.

Noctvision
A machine vision engineer who fits cameras, lenses, lighting, and image-processing algorithms together for a living. Years spent on continuous production lines, vibration, heat, and dust included, working through diffuse reflection, contrast, and resolution differences too fine for a spec sheet to capture inform every post here, closing the gap between theory and the shop floor. Off duty, that same eye for light and lenses goes into repairing fully mechanical vintage film cameras.


You May Also Like
How to Handle Imaging on Highly Reflective Surfaces
Can Correction Gain Erase Uneven Illumination? — The Limits of Flat-Field Correction and Designing Uniformity First